|
 To
make predictions about events, concepts, or phenomena,
researchers must perform detailed, objective analyses. One
procedure to use in such analyses is a census, in which every
member of the population is studied. Conducting a census for
each research project is impractical, however, and researchers
must resort to alternative methods. The
most widely used alternative is to select a random sample from
the population, examine it, and make predictions from it that
can be generalized to the population. There are several
procedures for identifying the units that are to compose a
random sample. To
make predictions about events, concepts, or phenomena,
researchers must perform detailed, objective analyses. One
procedure to use in such analyses is a census, in which every
member of the population is studied. Conducting a census for
each research project is impractical, however, and researchers
must resort to alternative methods. The
most widely used alternative is to select a random sample from
the population, examine it, and make predictions from it that
can be generalized to the population. There are several
procedures for identifying the units that are to compose a
random sample.
If
the scientific procedure is to provide valid and useful results,
researchers must pay close attention to the methods they use in
selecting a sample. This chapter will describe several types of
samples commonly used in mass media research. Some are
elementary and do not require a great deal of time or resources.
Other sampling methods entail great expense and time.
Researchers must decide whether costs and time are justified in
relation to the results generated.
Sampling procedures must not be taken lightly in the process of
scientific investigation. It makes no sense to develop a
research design for testing a valuable hypothesis or research
question and then nullify this effort by neglecting correct
sampling procedures. These procedures must be continually
scrutinized to ensure that the results of an analysis are not
sample-specific; that is, results are not based on the type of
sample used in the study.
This chapter describes the basics of the sampling methods that
are widely used in research. However, considering that sampling
theory has become a distinct discipline in itself, there are
some studies, such as nationwide surveys, that require a
consultation of more technical discussions of sampling.
3.1 Population and Sample
 One
goal of scientific research is to describe the nature of a
population, that is, a group or class of subjects, variables,
concepts, or phenomena.
In some cases this is achieved through the investigation of an
entire class or group, such as a study of prime-time television
programs during the week of September 10 — 16. The process of
examining every member of such a population is called a census.
In many situations, however, the chance of investigating an
entire population is remote, if not nonexistent, due to time and
resource constraints. Studying every member of a population is
also generally cost prohibitive, and may in fact confound the
research because measurements of large numbers of people often
affect measurement quality. One
goal of scientific research is to describe the nature of a
population, that is, a group or class of subjects, variables,
concepts, or phenomena.
In some cases this is achieved through the investigation of an
entire class or group, such as a study of prime-time television
programs during the week of September 10 — 16. The process of
examining every member of such a population is called a census.
In many situations, however, the chance of investigating an
entire population is remote, if not nonexistent, due to time and
resource constraints. Studying every member of a population is
also generally cost prohibitive, and may in fact confound the
research because measurements of large numbers of people often
affect measurement quality.
The
usual procedure in these instances is to select a sample from
the population. A sample is a subset of the population that
is taken to be representative of the entire population.
An important word in this definition is representative.
A sample that is not representative of the population,
regardless of its size, is inadequate for testing purposes: the
results cannot be generalized. |
|
|
3.2
Probability and Nonprobability Samples
 A
probability sample is selected according to mathematical
guidelines whereby the chance for selection of each unit is
known. A nonprobability sample does not follow the guidelines of
mathematical probability.
However, the most significant characteristic distinguishing the
two types of samples is that probability sampling allows
researchers to calculate the amount of sampling error present in
a research study; non-probability sampling does not. A
probability sample is selected according to mathematical
guidelines whereby the chance for selection of each unit is
known. A nonprobability sample does not follow the guidelines of
mathematical probability.
However, the most significant characteristic distinguishing the
two types of samples is that probability sampling allows
researchers to calculate the amount of sampling error present in
a research study; non-probability sampling does not.
In deciding whether to use a probability or a nonprobability
sample, a researcher should consider four points.
1. Purpose of the study:
Some research studies are not designed for generalization to
the population, but rather to investigate variable relationships
or to collect exploratory data for designing questionnaires or
measurement instruments. A nonprobability sample is often
appropriate in situations of these types.
2. Cost versus value:
The sample should produce the greatest value for the least
investment. If the cost of a probability sample is too high
in relation to the type and quality of information collected, a
nonprobability sample is a possible alternative.
3. Time constraints:
In many cases researchers collecting preliminary information
operate under time constraints imposed by sponsoring agencies,
management directives, or publication guidelines.
Since probability sampling is often
time-consuming, a non-probability sample may provide temporary
relief.
4. Amount of error allowed:
In preliminary or pilot studies, where
error control is not a prime concern, a nonprobability sample is
usually adequate.
Probability sampling generally incorporates some type of
systematic selection procedure, such as a table of random
numbers, to ensure that each unit has an equal chance of being
selected. However, it does not always guarantee a representative
sample from the population, even when systematic selection is
followed. It is possible to randomly select 50 members of the
student body at a university in order to determine the average
height of all students enrolled and, by extraordinary
coincidence, end up with 50 candidates for the basketball team.
Such an event is unlikely, but it is possible, and this
possibility underscores the need to replicate any study. |
|
|
3.3. Types of Nonprobability
Samples
 Nonprobability
sampling is frequently used in mass media research,
particularly in the form of available samples, samples using
volunteer subjects, and purposive samples. Mall intercepts
use nonprobability sampling. An available sample (also
known as convenience sample) is a collection of readily
accessible subjects for study, such as a group of students
enrolled in an introductory mass media course, or shoppers in a
mall. Although available samples can be helpful in
collecting exploratory information and may produce useful data
in some instances, the samples are problematic because they
contain unknown quantities of error. Researchers need to
consider the positive and negative qualities of available
samples before using them in a research study. Nonprobability
sampling is frequently used in mass media research,
particularly in the form of available samples, samples using
volunteer subjects, and purposive samples. Mall intercepts
use nonprobability sampling. An available sample (also
known as convenience sample) is a collection of readily
accessible subjects for study, such as a group of students
enrolled in an introductory mass media course, or shoppers in a
mall. Although available samples can be helpful in
collecting exploratory information and may produce useful data
in some instances, the samples are problematic because they
contain unknown quantities of error. Researchers need to
consider the positive and negative qualities of available
samples before using them in a research study.
Available samples are a subject of heated debate in many
research fields. Critics argue that regardless, of the results
they may generate, available samples do not represent the
population and therefore have no external validity.
Proponents of the available sample procedure claim that if a
phenomenon, characteristic, or trait does in fact exist, it
should exist in any sample. In addition, some scholars
have contested the very notion of sample representativeness.
Available samples can be useful in pretesting questionnaires or
other preliminary (pilot study) work. They often help eliminate
potential problems in research procedures, testing, and
methodology before the final research study is attempted.
Subjects who constitute a volunteer sample also form a
nonprobability sample,
since the individuals are not selected mathematically. There is
concern in all areas of research with regard to persons who
willingly participate in research projects; these subjects
differ greatly from non-volunteers and may consequently produce
erroneous research results. The
characteristics of volunteer subjects can be defined on the
basis of several studies and found that such subjects, in
comparison with nonvolunteers, tend to exhibit higher
educational levels, higher occupational status, greater need for
approval, higher intelligence, and lower authoritarianism. They
also seem to be more sociable, more "arousal-seeking," and more
unconventional; they are more likely to be first children, and
they are generally younger.
These characteristics mean that the use of volunteer subjects
may significantly bias the results of a research study and may
lead to inaccurate estimates of various population parameters.
Also, available data seem to indicate that volunteers may, more
often than nonvolunteers, provide data to support a researcher's
hypothesis. In some cases volunteer subjects are necessary—for
example, in comparison tests of products or services. However,
volunteers should be used with caution because, as with
available samples, there is an unknown quantity of error present
in the data.
Although volunteer samples have been shown to be inappropriate
in scientific research, the electronic media have begun to
legitimize volunteers through the various polls conducted on
radio and television stations, and the television networks.
Local television news programs, for example, often report the
results of the latest "viewer poll" about some local concern.
Even though announcers occasionally say that the polls are not
intended to be scientific in nature, the results are presented
as such. Unwary listeners and viewers are being conned by the
media. Such telephone polls are disturbing to legitimate
scientific researchers.
A purposive sample includes subjects selected on the basis of
specific characteristics or qualities and eliminates those who
fail to meet these criteria. Purposive samples are often used in
advertising studies: researchers select subjects who use a
particular type of product and ask them to compare it with a new
product.
A
purposive sample is chosen with the knowledge that it is not
representative of the general population; rather it attempts to
represent a specific portion of the population. In a similar
method, the quota sample, subjects are selected to meet a
predetermined or known percentage. For example, a researcher
interested in finding out how VCR owners differ in their use of
television from non-VCR-owners may know that 10% of a particular
population owns a VCR. The sample the researcher selected,
therefore, would be composed of 10% of VCR owners and 90%
non-VCR-owners (to reflect the population characteristics).
Another nonprobability sampling method is to select subjects
haphazardly on the basis of appearance or convenience,
or because they seem to meet certain requirements (the subjects
look educated). Haphazard selection involves researcher
subjectivity and introduces error. Some haphazard samples give
the illusion of a probability sample; these must be carefully
approached. For example, interviewing every 10th
person who walks by in a shopping center is haphazard, since not
everyone in the population has an equal chance of walking by
that particular location. Some people live across town, some
shop in other centers, and so on.
Some researchers, research suppliers, and field services try to
work around the problems associated with convenience samples in
mall intercepts by using a procedure based on what is called
"The Law of Large Numbers." Essentially, the researchers
interview thousands of respondents instead of hundreds. The
presumption (and sales approach used on clients) is that the
large number of respondents eliminates the problems of
convenience sampling. It does not. The large number
approach is still a convenience sample. It is not a random
sample as described in the first sentence of the next section. |
|
|
3.4 Types of Probability
Sample
3.4.1 Simple Random Sample
 The
most basic type of probability sampling is the simple random
sample, where each subject or unit in the population has an
equal chance of being selected.
If a subject or unit is drawn from the
population and removed from subsequent selections, the procedure
is known as random sampling without replacement — the
most widely used random sampling method. Random sampling with
replacement involves returning the subject or unit into the
population so that it has a chance of being chosen another time.
Sampling with replacement is often used in more complicated
research studies such as nationwide surveys. The
most basic type of probability sampling is the simple random
sample, where each subject or unit in the population has an
equal chance of being selected.
If a subject or unit is drawn from the
population and removed from subsequent selections, the procedure
is known as random sampling without replacement — the
most widely used random sampling method. Random sampling with
replacement involves returning the subject or unit into the
population so that it has a chance of being chosen another time.
Sampling with replacement is often used in more complicated
research studies such as nationwide surveys.
Researchers usually use a table of random numbers to generate a
simple random sample. For example, a researcher, who wants to
analyze 10 prime-time television programs out of a total
population of 100 programs to determine how the medium portrays
elderly people, can take a random sample from the 100 programs
by numbering each show from 00 to 99 and then selecting 10
numbers from a table of random numbers. First, a starting point
in the table is selected at random. There is no specific way to
choose a starting point; it is an arbitrary decision. The
researcher then selects the remaining 9 numbers by going up,
down, left, or right on the table — or even randomly throughout
the table. For example, if it is decided to go down in the table
from the starting point 44 until a sample of 10 has been drawn,
the sample would include television programs numbered 44, 85,
46, 71, 17, 50, 66, 56, 03, and 49.
Simple random samples for use in telephone surveys are often
obtained by a process called random digit dialing.
One method involves randomly selecting four-digit numbers
(usually generated by a computer or through the use of a random
numbers table) and adding them to the three-digit exchange
prefixes in the city in which the survey is conducted. A
single four-digit series may be used once, or it may be
added to all the prefixes.
Unfortunately, a large number of the telephone numbers generated
by this method of random digit dialing are invalid because some
phones have been disconnected, some numbers generated have not
yet been assigned, and for other reasons. Therefore, it is
advisable to produce at least three times the number of
telephone numbers needed; if a sample of 100 is required, at
least 300 numbers should be generated to allow for invalid
numbers.
A second random digit dialing method
that tends to decrease the occurrence of invalid numbers
involves adding from one to three random digits to a telephone
number selected from a phone directory or list of phone numbers.
One first selects a number from a list of telephone numbers (a
directory or list purchased from a supplier). Assume that the
number 448-3047 was selected from the list. The researcher could
simply add a predetermined number, say 6, to produce 448-3053;
or a predetermined two-digit number, say 21, to achieve
448-3068; or even a three-digit number, say 112, to produce
448-3159. Each variation of the method helps to eliminate many
of the invalid numbers produced in pure random number
generation, since telephone companies tend to distribute
telephone numbers in series, or blocks. In this example, the
block 30— is in use, and there is a good chance that random
add-ons to this block will be residential telephone numbers.
As
indicated here, random number generation is possible via a
variety of methods. However, two rules are always applicable:
(1)each unit or subject in the population must have an equal
chance of being selected, and (2) the selection procedure must
be free from subjective intervention by the researcher.
The purpose of random sampling is to
reduce sampling error; violating random sampling rules only
increases the chance of introducing such error into a study.
Similar in some ways to simple random sampling is a procedure
called systematic sampling, in which every X subject or unit is
selected from a population.
For example, to get a sample of 20 from a population of 100, or
a sampling rate of 1/5, a researcher randomly selects a starting
point and a sampling interval. Thus, if the number 11 is chosen,
the sample will include the 20 subjects or items numbered 11,
16, 21, 26, and so on. To add further randomness to the process,
the researcher may randomly select both the starting point and
the interval. For example, an interval of 11 together with a
starting point of 29 would generate the numbers 40, 51, 62, 73,
and so on.
 A)
Advantages A)
Advantages
-
Detailed knowledge of the
population is not required.
-
External validity may be
statistically inferred.
-
A representative group is
easily obtainable.
-
The possibility of
classification error is eliminated.
 B)
Disadvantages B)
Disadvantages
-
A list of the population
must be compiled.
-
A representative sample may
not result in all cases.
-
The procedure can be more
expensive than other methods.
3.4.2 Systematic Sample
Systematic samples are frequently used in social research. They
often save time, resources, and effort when compared to simple
random samples.
In fact, since the procedure so closely resembles a simple
random sample, many researchers consider systematic sampling
equal to the random procedure. The method is widely used in
selecting subjects from lists such as telephone directories,
Broadcasting/Cdblecasting Yearbook, and
Editor & Publisher.
The degree of accuracy of systematic sampling depends on the
adequacy of the sampling frame, or a complete list of members in
the population.
Telephone
directories
are inadequate sampling frames in most cases, since not all
phone numbers are listed, and some people do not have telephones
at all. However, lists that include all the members of a
population have a high degree of precision. Before deciding
to use systematic sampling, one should consider the goals and
purpose of a study, as well as the availability of a
comprehensive list of the population. If such a list is not
available, systematic sampling is probably ill-advised.
One major problem associated with systematic sampling is that
the procedure is susceptible to periodicity; that is, the
arrangements or order of the items in the population list may
bias the selection process.
For
example, consider the problem mentioned earlier of analyzing
television programs to determine how the elderly are portrayed.
Quite possibly, every 10th program listed may have
been aired by Channel 1; the result would be a nonrepresentative
sampling of the three networks.
Periodicity also causes problems when telephone directories are
used to select samples. The alphabetical listing does not allow
each person or household an equal chance of being selected. One
way to solve the problem is to cut each name from the directory,
place them in a "hat," and draw names randomly. Obviously, this
would take days to accomplish and is not a real alternative. An
easier way to use a directory is to tear the pages loose, mix
them up, randomly select pages, and then randomly select names.
Although this procedure doesn't totally solve the
problem, it is generally accepted when simple random sampling is
impossible. If periodicity is eliminated, systematic sampling
can be an excellent sampling methodology.
A)
Advantages
-
Selection is easy.
-
Selection can be more
accurate than in a simple random sample.
-
The procedure is generally
inexpensive.
B)
Disadvantages
-
A complete list of the
population must be obtained.
-
Periodicity may bias the
process.
3.4.3 Stratified Sample
Although a simple random sample is the usual choice in most
research projects, some researchers don't wish to rely on
randomness.
In some projects, researchers want to guarantee that a
specific sub sample of the population is adequately represented.
No such guarantee is possible using a simple random sample.
A stratified sample is the approach used when adequate
representation from a sub sample is desired. The characteristics
of the sub sample (strata or segment) may include almost any
variable: age, sex, religion, income level, or even individuals
who listen to specific radio stations or read certain magazines.
The strata may be defined by an almost unlimited number of
characteristics; however, each additional variable or
characteristic makes the sub sample more difficult to find.
Therefore, incidence drops.
Stratified sampling ensures that a sample is drawn from a
homogeneous subset of the population, that is, from a population
with similar characteristics. Homogeneity helps researchers to
reduce sampling error.
For example, consider a research study on subjects' attitudes
toward two-way, interactive cable television. The investigator,
knowing that cable subscribers tend to have higher achievement
levels, may wish to stratify the population according to
education. Before randomly selecting subjects, the researcher
divides the population into three levels: grade school, high
school, and college. Then, if it is determined that 10% of the
population completed college, a random sample proportional to
the population should contain 10% who meet this standard.
The stratified sampling ensures the proper
representation of the stratification variables to enhance
representation of other variables related to them. Taken as a
whole, then, a stratified sample is likely to be more
representative on a number of variables than a simple random
sample.
Stratified sampling can be applied in two different ways.
Proportionate stratified sampling includes strata with
sizes based on their proportion in the population. If 30% of
the population is adults (18 – 24 years), then 30% of the total
sample will be subjects in this age group. This procedure is
designed to give each person in the population an equal chance
of being selected. Disproportionate stratified sampling
is used to over sample or over represent a particular
stratum. The approach is used basically because the stratum is
considered important for some reason: marketing, advertising, or
other similar reasons. For example, a radio station that
targets 25- to 54-year-old individuals may have ratings problems
with the 25- to 34-year-old group. In a telephone study of 500
respondents, the station management may wish to have the sample
represented as: years old, 70% 25-34, 20% 35-49, and 10% 50-54.
This distribution would allow researchers to break the 25-34
group in smaller groups such as males, females, fans of specific
stations, and other subcategories and still have reasonable
sample sizes.
A) Advantages
1. Representativeness of relevant variables is ensured.
2. Comparisons can be made to other populations.
3. Selection is made from a homogeneous group.
4. Sampling error is reduced.
B) Disadvantages
1. Knowledge of the population prior to selection is required.
2. The procedure can be costly and time- consuming.
3. It can be difficult to find a sample if incidence is low.
4. Variables that define strata may not be relevant.
3.4.4 Cluster Sample
The usual sampling procedure is to select one
unit or subject at a time.
But this requires the researcher to have a complete list of
the population. In some cases there is no way to obtain such a
list. One way to avoid this problem is to select the sample in
groups or categories; this procedure is known as cluster
sampling. For example, analyzing magazine readership habits
of people in the state of Wisconsin would be time-consuming and
complicated if individual subjects were randomly selected. With
cluster sampling, one can divide the state into districts,
counties, or zip code areas and select groups of people from
these areas.
Cluster sampling creates two types of error: in addition to the
error involved in defining the initial clusters, errors may
arise in selecting from the clusters.
For example, a zip code area may comprise mostly residents of a
low socio-economic status who are unrepresentative of the
remainder of the state; if selected for analysis, such a group
may confound the research results. To
help control such error, it is best to use small areas or
clusters, both to decrease the number of elements in each
cluster and to maximize the number of clusters selected.
In many nationwide studies, researchers use a form of cluster
sampling called multistage sampling, in which individual
households or persons are selected, not groups. Figure 3.1
demonstrates a four-stage sequence for a nationwide survey.
First, a cluster of counties (or another specific geographic
area) in the United States is selected. This cluster is narrowed
by randomly selecting a county, district, or block group within
the principal cluster. Next, individual blocks are selected
within each area. Finally, a convention such as "the third
household from the northeast corner" is established, and then
the individual households in the sample can be identified by
applying the selection formulation the stages just described.
In
many cases researchers also need to randomly select an
individual in a given household. In most cases researchers
cannot count on being able to interview the person who happens
to answer the telephone. Usually
demographic quotas are established for a research study, which
means that a certain percentage of all respondents must be of a
certain sex or age. In this type of study, researchers determine
which person in the household should answer the questionnaire by
using a form of random numbers table.
Figure 3.1: Four-stage sequence for a nationwide survey
To
get a random selection of individuals in the selected
households, the interviewer simply asks each person who answers
the telephone, "How many people are there in your home who is
aged 12 or older?" If the first respondent answers "Five," the
interviewer asks to speak to the fifth oldest (the youngest in
this case) person in the home. Each time a call is completed,
the interviewer checks off on the table the number representing
the person questioned. If the next household called also had
five family members, the interviewer would move to the next
number in the 5 column and ask to talk to the third oldest
person in the home.
The
same table can be used to select respondents by sex. That is,
the interviewer could ask, "How many males who are age 12 or
older live in your home?" The interviewer could then ask for the
"nth" oldest male, or female, according to the
requirements of the survey.
Since media are complex systems, researchers frequently
encounter complicated sampling methods. These are known as
hybrid situations.
Consider some researchers attempting to determine the potential
for videotext distribution of a local newspaper to cable
subscribers. This problem requires investigating readers and
nonreaders of the newspaper as well as cable subscribers and
nonsubscribers. The research, therefore, requires random
sampling from the following four groups:
Group A Subscribers/Readers
Group B Subscribers/Nonreaders
Group C Nonsubscribers/Readers
Group D Nonsubscribers/Nonreaders
Researchers must identify each subject as belonging to one of
these four groups. If three variables were involved, sampling
from eight groups would be required, and so on. In other words,
researchers are often faced with very complicated sampling
situations that involve numerous steps.
A)
Advantages
-
Only part of the population
need to be enumerated.
-
Costs are reduced if
clusters are well defined.
-
Estimates of cluster
parameters are made and compared to the population.
B)
Disadvantages
-
Sampling errors are likely.
-
Clusters may not be
representative of the population.
-
Each subject or unit must
be assigned to a specific cluster.
|
|
|
3.5 Sample Size
Determining an adequate sample size is one of the most
controversial aspects of sampling.
How large must a sample be to provide the desired level of
confidence in the results? Unfortunately, there is no simple
answer. There are suggested sample
sizes for various statistical procedures, but no single sample
size formula or method is available for every research method or
statistical procedure. For this reason, it is advisable to
consult sampling texts for information concerning specific
techniques.
The size of the sample required for a study depends on at least
one or more of the following seven points: (1) project type, (2)
project purpose, (3) project complexity, (4) amount of error
willing to be tolerated, (5) time constraints, (6) financial
constraints, and (7) previous research in the area.
Research designed as a preliminary investigation to search for
general indications generally does not require a large sample.
However, projects intended to answer significant questions
(those designed to provide information for decisions involving
large sums of money or decisions that may affect people's lives)
require high levels of precision and, therefore, large samples.
A few general principles are used to guide researchers in
determining an acceptable sample size. These suggestions are not
based on mathematical or statistical theory, but they should
provide a starting point in most cases.
-
A primary consideration in
determining sample size is the research method used.
Focus groups (Chapter 7) use samples of 6-12 people, but the
results are not intended to be generalized to the population
from which the respondents were selected. Samples of 25-50
are commonly used for pretesting measurement instruments,
pilot studies, and for studies conducted only for heuristic
value.
-
A sample of 100 subjects
per demographic group (such as adults 18 - 24 years old) is
often used by researchers.
This base figure is used to "back in" to a total sample
size. For example, assume a researcher is planning to
conduct a telephone study with adults 18 - 54. Using the
normal mass media age spans of 18 - 24, 25 - 34, 35 - 44,
and 45 - 54, the researcher would probably consider a total
sample of 400 as satisfactory (100 per age group, or
"cell"). However, the researcher may also wish to
investigate the differences in opinions/attitudes among men
and women, which produces a total of eight different
demographic cells. In this case, a sample of 800 would
probably be used — 100 for each of the cell possibilities.
-
Sample size is almost
always controlled by cost and time.
Although researchers may wish to use a sample of 1,000 for a
survey, the economics of such sample are usually
prohibitive. Research with 1,000 respondents can easily
exceed $50,000. Most research work is conducted using a
sample that conforms to the project's budget. If a small
sample is forced on a researcher by someone else (a client
or project manager), the results must be interpreted
accordingly — that is, with caution regarding the
generalization of results.
-
Multivariate studies always
require larger samples than univariate studies
because they involve the analysis of multiple response data
(several measurements on the same subject).One guideline
recommended for multivariate studies is: 50 = very poor;
-
100 = poor; 200 = fair; 300
= good; 500 = very good; 1,000 = excellent.
Other researchers suggest using a sample of 100 plus 1
subject for each dependent variable in the analysis.
-
Researchers should always
select a larger sample than is actually required for a
study, since
mortality must be compensated for. Subjects drop out of
research studies for one reason or another, and allowances
must be made for this in planning the sample selection.
Subject mortality is especially prevalent in panel studies,
where the same group of subjects is tested or measured
frequently over a long period of time. In most cases,
researchers can expect from 10% to 25% of the sample to drop
out of a study before it is completed.
-
Information about sample
size is available in published research.
Consulting the work of other researchers provides a base
from which to start. If a survey is planned and similar
research indicates that a representative sample of 400 has
been used regularly with reliable results, a sample larger
than 400 may be unnecessary.
-
Generally speaking, the
larger the sample used the better. However, a large
unrepresentative sample is as meaningless as a small
unrepresentative sample, so researchers should not consider
numbers alone. Quality is always more important in sample
selection than mere size.
|
|
|
3.6 Sampling Error
Since researchers deal with samples from a population, there
must be some way for them to compare the results of (or make
inferences about) what was found in the sample to what exists in
the target population.
The comparison allows researchers to determine the accuracy of
their data and involves the computation of error. All
researches involve error: sampling error, measurement error, and
random error (also called unknown or uncontrollable error).
Sampling error is also known as standard error. The different
sources of error are additive. That is, total error is the sum
of the three different sources. This section discusses
sampling error in mass media research.
Sampling error occurs when measurements taken from a sample do
not correspond to what exists in the population.
For example, assume we wish to measure attitudes toward a new
television program by 18- to 24-year-old viewers in Denver,
Colorado. Further assume that all the viewers produce an average
score of 6 on a 10-point program appeal measurement scale. Some
viewers may dislike the program and rate the show a 1, 2 or 3,
some find it mediocre and rate it 4, 5, 6, or 7, whereas the
remaining viewers consider the show one of their favorites and
rate it an 8, 9, or 10. The differences among the 18- to
24-year-old viewers provide an example of how sampling error may
occur. If we asked each viewer to rate the show in a separate
study and each one rated the program a 6, then no error exists.
However, an error-free sample is unlikely.
Respondent differences do exist; some dislike the program and
others like it. Although the average program rating is 6 in the
hypothetical example, it is possible to select a sample from the
target population that does not match the average rating. A
sample could be selected that includes only viewers who dislike
the program. This would misrepresent the population because the
average appeal score would be lower than the mean score.
Computing the rate of sampling error allows researchers to have
an idea concerning the risk involved in accepting research
findings as "real."
Computing sampling error is appropriate only with probability
samples. Sampling error cannot be computed in research using
non-probability samples because everyone did not have an equal
chance of being selected. This is one reason why nonprobability
samples are used only in preliminary research or in studies
where error rates are not considered important.
Sampling error computations are essential in research and are
based on the concept of the central limit theorem.
In its simplest form, the theorem
states that the sum of a large number of independent and
identically distributed random variables (or sampling
distributions), has an approximate normal distribution. A
theoretical sampling distribution is the set of all possible
samples of a given size. This distribution of values is
described by a bell-shaped curve, or normal curve (also known as
a Gaussian distribution, after German mathematician and
astronomer Karl F. Gauss who used the concept to analyze
observational errors). The normal distribution is important in
computing sampling error because sampling errors (a sampling
distribution) made in repeated measurements tend to be normally
distributed.
Computing standard error is a process of determining, with a
certain amount of confidence, the difference between a sample
and the target population.
Error occurs by chance, or through some fault of the research
procedure. However, when probability sampling is used, the
incidence of error can be determined because of the relationship
between the sample and the normal curve.
A normal curve is symmetrical about the mean or
midpoint, which indicates that an equal number of scores lie on
either side of the midpoint.
In
every normal distribution, the standard deviation defines a
standard unit of distance from the midpoint of the distribution
to the outer limits of the distribution. These standard
deviation interval unit(values) are used in establishing a
confidence interval that is accepted in a research project. In
addition, the standard deviation units indicate the amount of
standard error. For example, using an interval (confidence
interval) of + or — one standard deviation unit — 1 standard
error — says that the probability is that 68% of the sample
selected from the population will produce estimates within that
distance from the population value (one standard deviation
unit).
3.6.1 Computing Standard Error
 The
essence of statistical hypothesis testing is to draw a sample
from a target population, compute some type of statistical
measurement, and compare the results to the theoretical sampling
distribution. The comparison determines the frequency with which
sample values of a statistic are expected to occur. The
essence of statistical hypothesis testing is to draw a sample
from a target population, compute some type of statistical
measurement, and compare the results to the theoretical sampling
distribution. The comparison determines the frequency with which
sample values of a statistic are expected to occur.
The expected value of a statistic is the mean of the
sampling distribution. The standard error is the standard
deviation of the sampling distribution.
There are several ways to compute standard (sampling) error, but
no single method is appropriate for all sample types or for all
situations. In addition, error formulas vary in complexity. One
error formula, designed for estimating audience sizes during
certain time periods or for certain programs and for measuring
cumulative audiences uses the standard error of a percentage
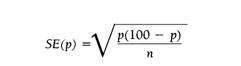
derived from a simple random sample. If
the sample percent is designated as p, the size of the
sample as n, and the estimated or standard error of the
sample percentage as SE(p), the formula is:
Suppose a random sample of 500 households produces a rating (or
estimate of the percentage of viewers) of 20 for a particular
show. This means that 20% of those households were tuned in to
that channel at that time. The formula
can be used to calculate the standard error as follows:
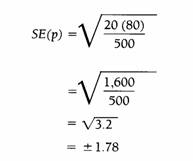
That is, the rating of 20 computed in the survey is subject to
an error of ± 1.78 points; the actual rating could be as low as
18.22 or as high as 21.78.
Standard error is directly related to sample size. The error
figure improves as the sample size is increased, but in
decreasing increments. Thus, an increase in sample size does not
provide a big gain.
As can be seen, even with a sample of 1,500, the standard error
is only .75 better than with a sample of 500 computed above. A
researcher would need to determine whether the increase in time
and expense caused by an additional 1,000 subjects would justify
such a proportionally small increase in precision.
The following table shows the amount of error at the 95%
confidence level for measurements that contain dichotomous
variables (such as "yes/ no").
For example, with a sample of 1,000 and a 30% "yes" response to
a question, the probable error due to sample size alone is ±
2.9. This means that we are 95% sure that our values for this
particular question fall between 27.1% and 32.9%. Sampling error
is an important concept in all research areas because it
provides an indication of the degree of accuracy of the
research.
Research studies published by large audience measurement firms
such as Arbitron and A. C. Nielsen are required by the
Electronic Media Ratings Council to include simplified charts to
assist in determining sampling error. In addition, each company
provides some type of explanation about error, such as the
Arbitron statement contained in every ratings book:
Arbitron estimates are subject to statistical variances
associated with all surveys using a sample of the universe. . .
. The accuracy of Arbitron estimates, data and reports and their
statistical evaluators cannot be determined to any precise
mathematical value or definition.
Statistical error due to sampling is found in all research
studies. Researchers must pay specific attention to the
potential sources of error in any study. Producing a study
riddled with error is tantamount to never having conducted the
study at all. If the magnitude of error was subject to accurate
assessment, researchers could simply determine the source of
error and correct it. Since this is not possible, however, they
must accept error as part of the research process, attempt to
reduce its effects to a minimum, and remember always to
interpret their results with regard to its presence. |
|
|
3.7 Sample Weighting
 In
an ideal research study, a researcher should have enough
respondents or subjects with the required demographic,
psychographic (why people behave in specific ways), or lifestyle
characteristic. The ideal sample, however, is rare, due to the
time and budget constraints of most research. Instead of
canceling a research project because of sampling inadequacies,
most researchers utilize a statistical procedure known as
weighting, or sample balancing. That is, when subject totals in
given categories do not reach the necessary population
percentages, subjects' responses are multiplied (weighted) to
allow for the shortfall. A single subject's responses may be
multiplied by 1.3, 1.7, 2.0, or any other figure to reach the
predetermined required level. In
an ideal research study, a researcher should have enough
respondents or subjects with the required demographic,
psychographic (why people behave in specific ways), or lifestyle
characteristic. The ideal sample, however, is rare, due to the
time and budget constraints of most research. Instead of
canceling a research project because of sampling inadequacies,
most researchers utilize a statistical procedure known as
weighting, or sample balancing. That is, when subject totals in
given categories do not reach the necessary population
percentages, subjects' responses are multiplied (weighted) to
allow for the shortfall. A single subject's responses may be
multiplied by 1.3, 1.7, 2.0, or any other figure to reach the
predetermined required level.
Subject weighting is a controversial data manipulation
technique, especially in the area of broadcast ratings.
The major question is just how much one subject's responses can
be weighted and still be representative. |
|
|
|